💡说明
https://facebook.github.io/prophet/docs/saturating_forecasts.html
默认情况下,Prophet使用线性模型进行预测。在预测增长时,通常会有一些最大可实现点:市场总规模、人口总规模等。这就是所谓的承载力,预测应该在这个点达到饱和。
Prophet允许你使用logistic growth趋势模型进行预测,并有指定的承载能力。我们用维基百科上R(编程语言)页面的访问对数来说明。
# Rdf <- read.csv('../examples/example_wp_log_R.csv')
# Pythondf = pd.read_csv('../examples/example_wp_log_R.csv')
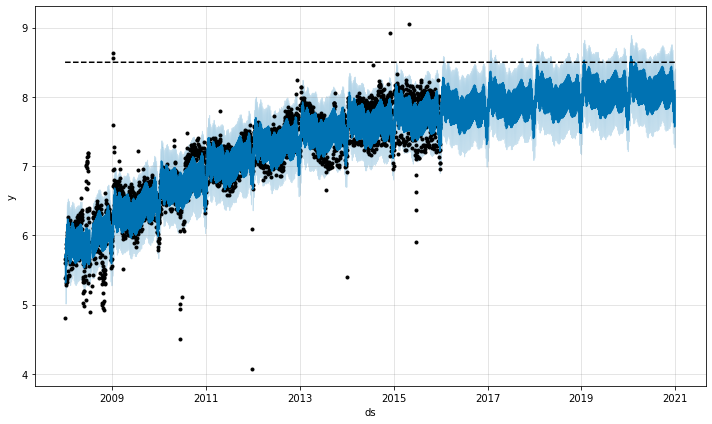
我们必须在 cap一栏中指定承载能力。在这里,我们将假定一个特定的值,但这通常是利用市场规模的数据或专业知识来设定的。
# Rdf$cap <- 8.5
# Pythondf['cap'] = 8.5
需要注意的是,必须为dataframe中的每一行指定 cap。它不一定是常数。如果市场规模在增长,那么cap可以是一个递增序列。
然后,我们像之前一样拟合模型,只是传递一个额外的参数来指定logistic growth。
# Rdf$cap <- 8.5
# Pythondf['cap'] = 8.5
我们像之前一样,为未来的预测做一个dataframe ,只是我们还必须指定未来的容量。在这里,我们将容量保持在与历史相同的值,并预测未来5年。
# Rfuture <- make_future_dataframe(m, periods = 1826)future$cap <- 8.5fcst <- predict(m, future)plot(m, fcst)
# Pythonfuture = m.make_future_dataframe(periods=1826)future['cap'] = 8.5fcst = m.predict(future)fig = m.plot(fcst)
png
ogistic function的隐含最小值为0,并将在0处达到饱和,与在容量处达到饱和的方式相同。也可以指定一个不同的饱和最小值。
logistic growth模型还可以处理饱和最小值,用 floor列指定,与 cap列指定最大值的方式相同。
# Rdf$y <- 10 - df$ydf$cap <- 6df$floor <- 1.5future$cap <- 6future$floor <- 1.5m <- prophet(df, growth = 'logistic')fcst <- predict(m, future)plot(m, fcst)
# Pythondf['y'] = 10 - df['y']df['cap'] = 6df['floor'] = 1.5future['cap'] = 6future['floor'] = 1.5m = Prophet(growth='logistic')m.fit(df)fcst = m.predict(future)fig = m.plot(fcst)
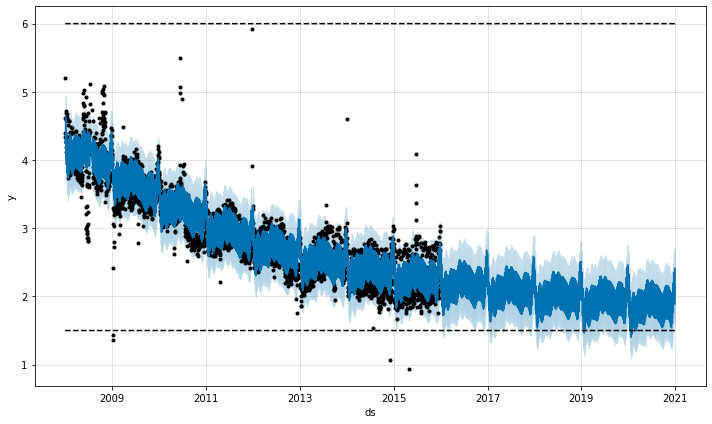
png
要使用最小饱和的logistic growth trend,还必须指定最大容量。